Assessing the July 2025 New York and New Jersey floods: Previsico’s post-event insights
- Written by
 Lauren Legate
Overview
A powerful storm on July 14–15, 2025, brought flash flooding to parts of New York, New Jersey and southern Pennsylvania, causing two people to lose their lives.
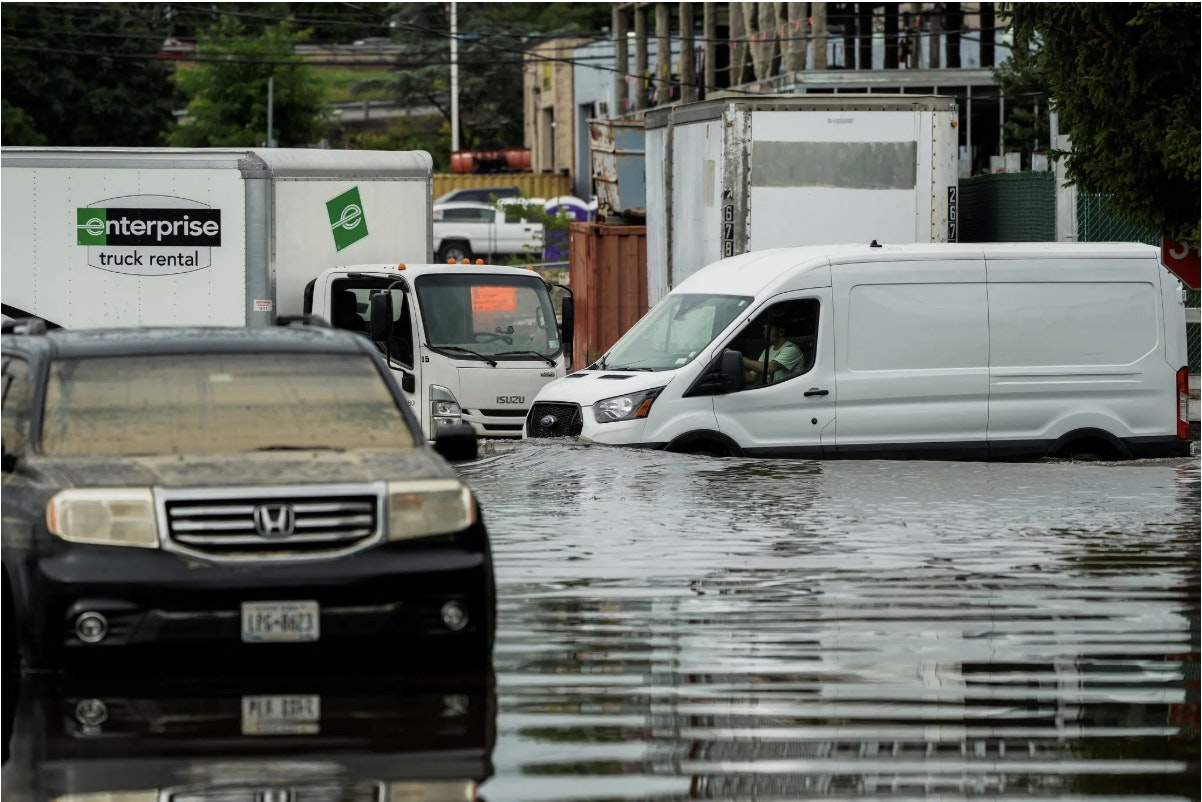
In New Jersey, Governor Phil Murphy declared a state of emergency, instructing residents to stay indoors and avoid unnecessary travel after storm totals reached 4–7 inches.
In New York City, basement‑dwelling residents were urged to be ready to evacuate quickly as heavy rainfall.
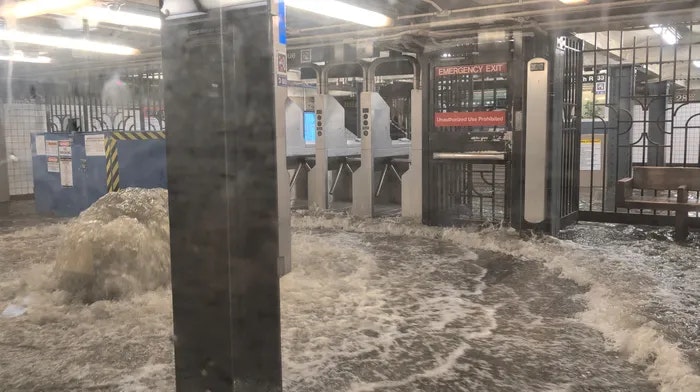
Subway services were severely disrupted: the lines in Manhattan were suspended, and trains in Queens suffered major delays. Dramatic footage captured platforms flooding as water streamed into stations, leaving passengers stranded on trains.
At LaGuardia, JFK and Newark Liberty airports, flights were delayed or grounded as ground stops were issued due to thunderstorms—with nearly 1,200 to 2,000 flights cancelled or delayed across the region.
Previsico's analysis
Following the flood event, Previsico carried out a bespoke retrospective analysis known as an Instacast on Demand, a tailored review of a flood event.
As seen in the maps below created from Previsico’s analysis, high localised rainfall clusters are shown in the Southwest and Northeast areas around New York/New Jersey, led to the urban drainage system being overwhelmed. Extensive flooding is generated in our model even with high drainage values, indicating very heavy local rainfall.
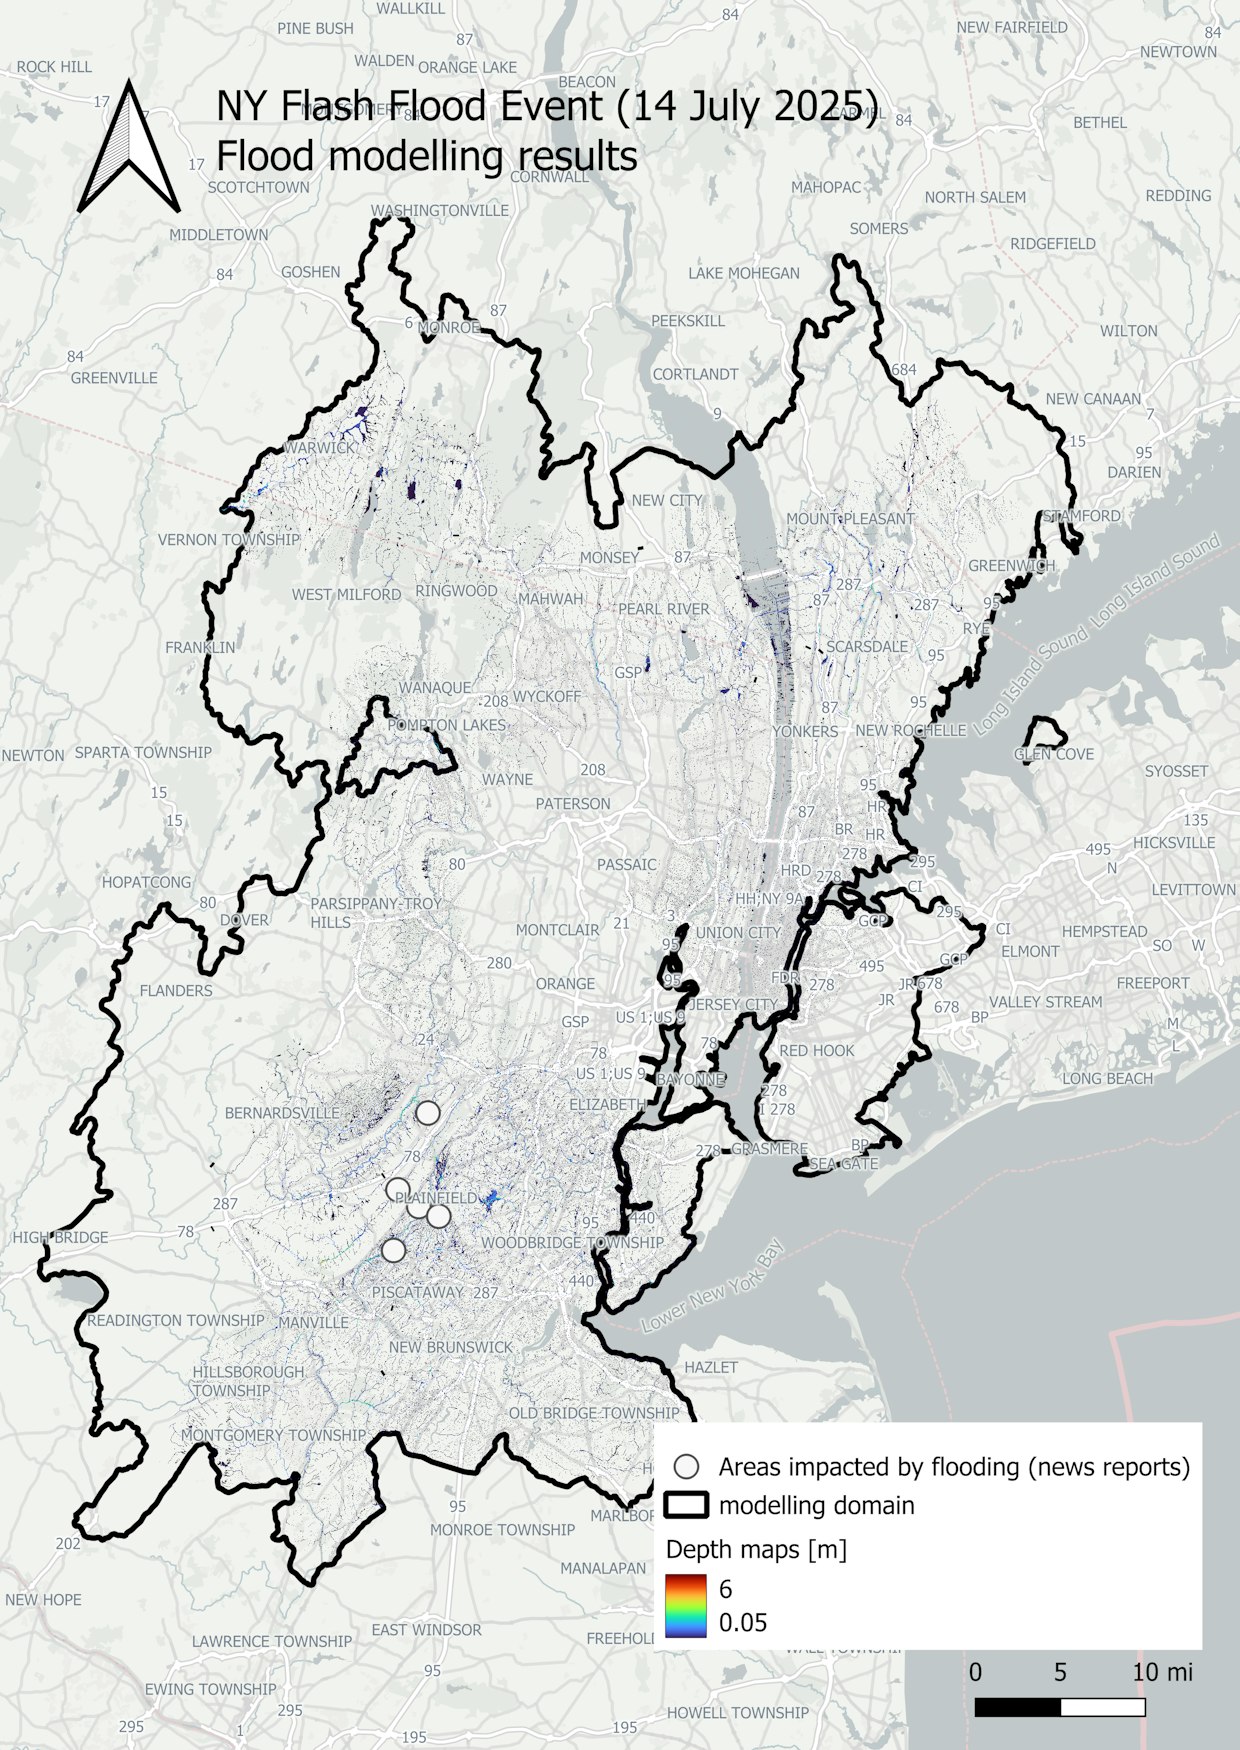
The flooding in New York was caused by intense, localised rainfall that overwhelmed urban drainage systems, particularly in southwest and northeast New York and New Jersey. Our model shows severe flooding, which even impacted areas with high drainage capacity. These kinds of extreme weather events are becoming more frequent and intense due to climate change, exposing the growing vulnerability of urban infrastructure systems

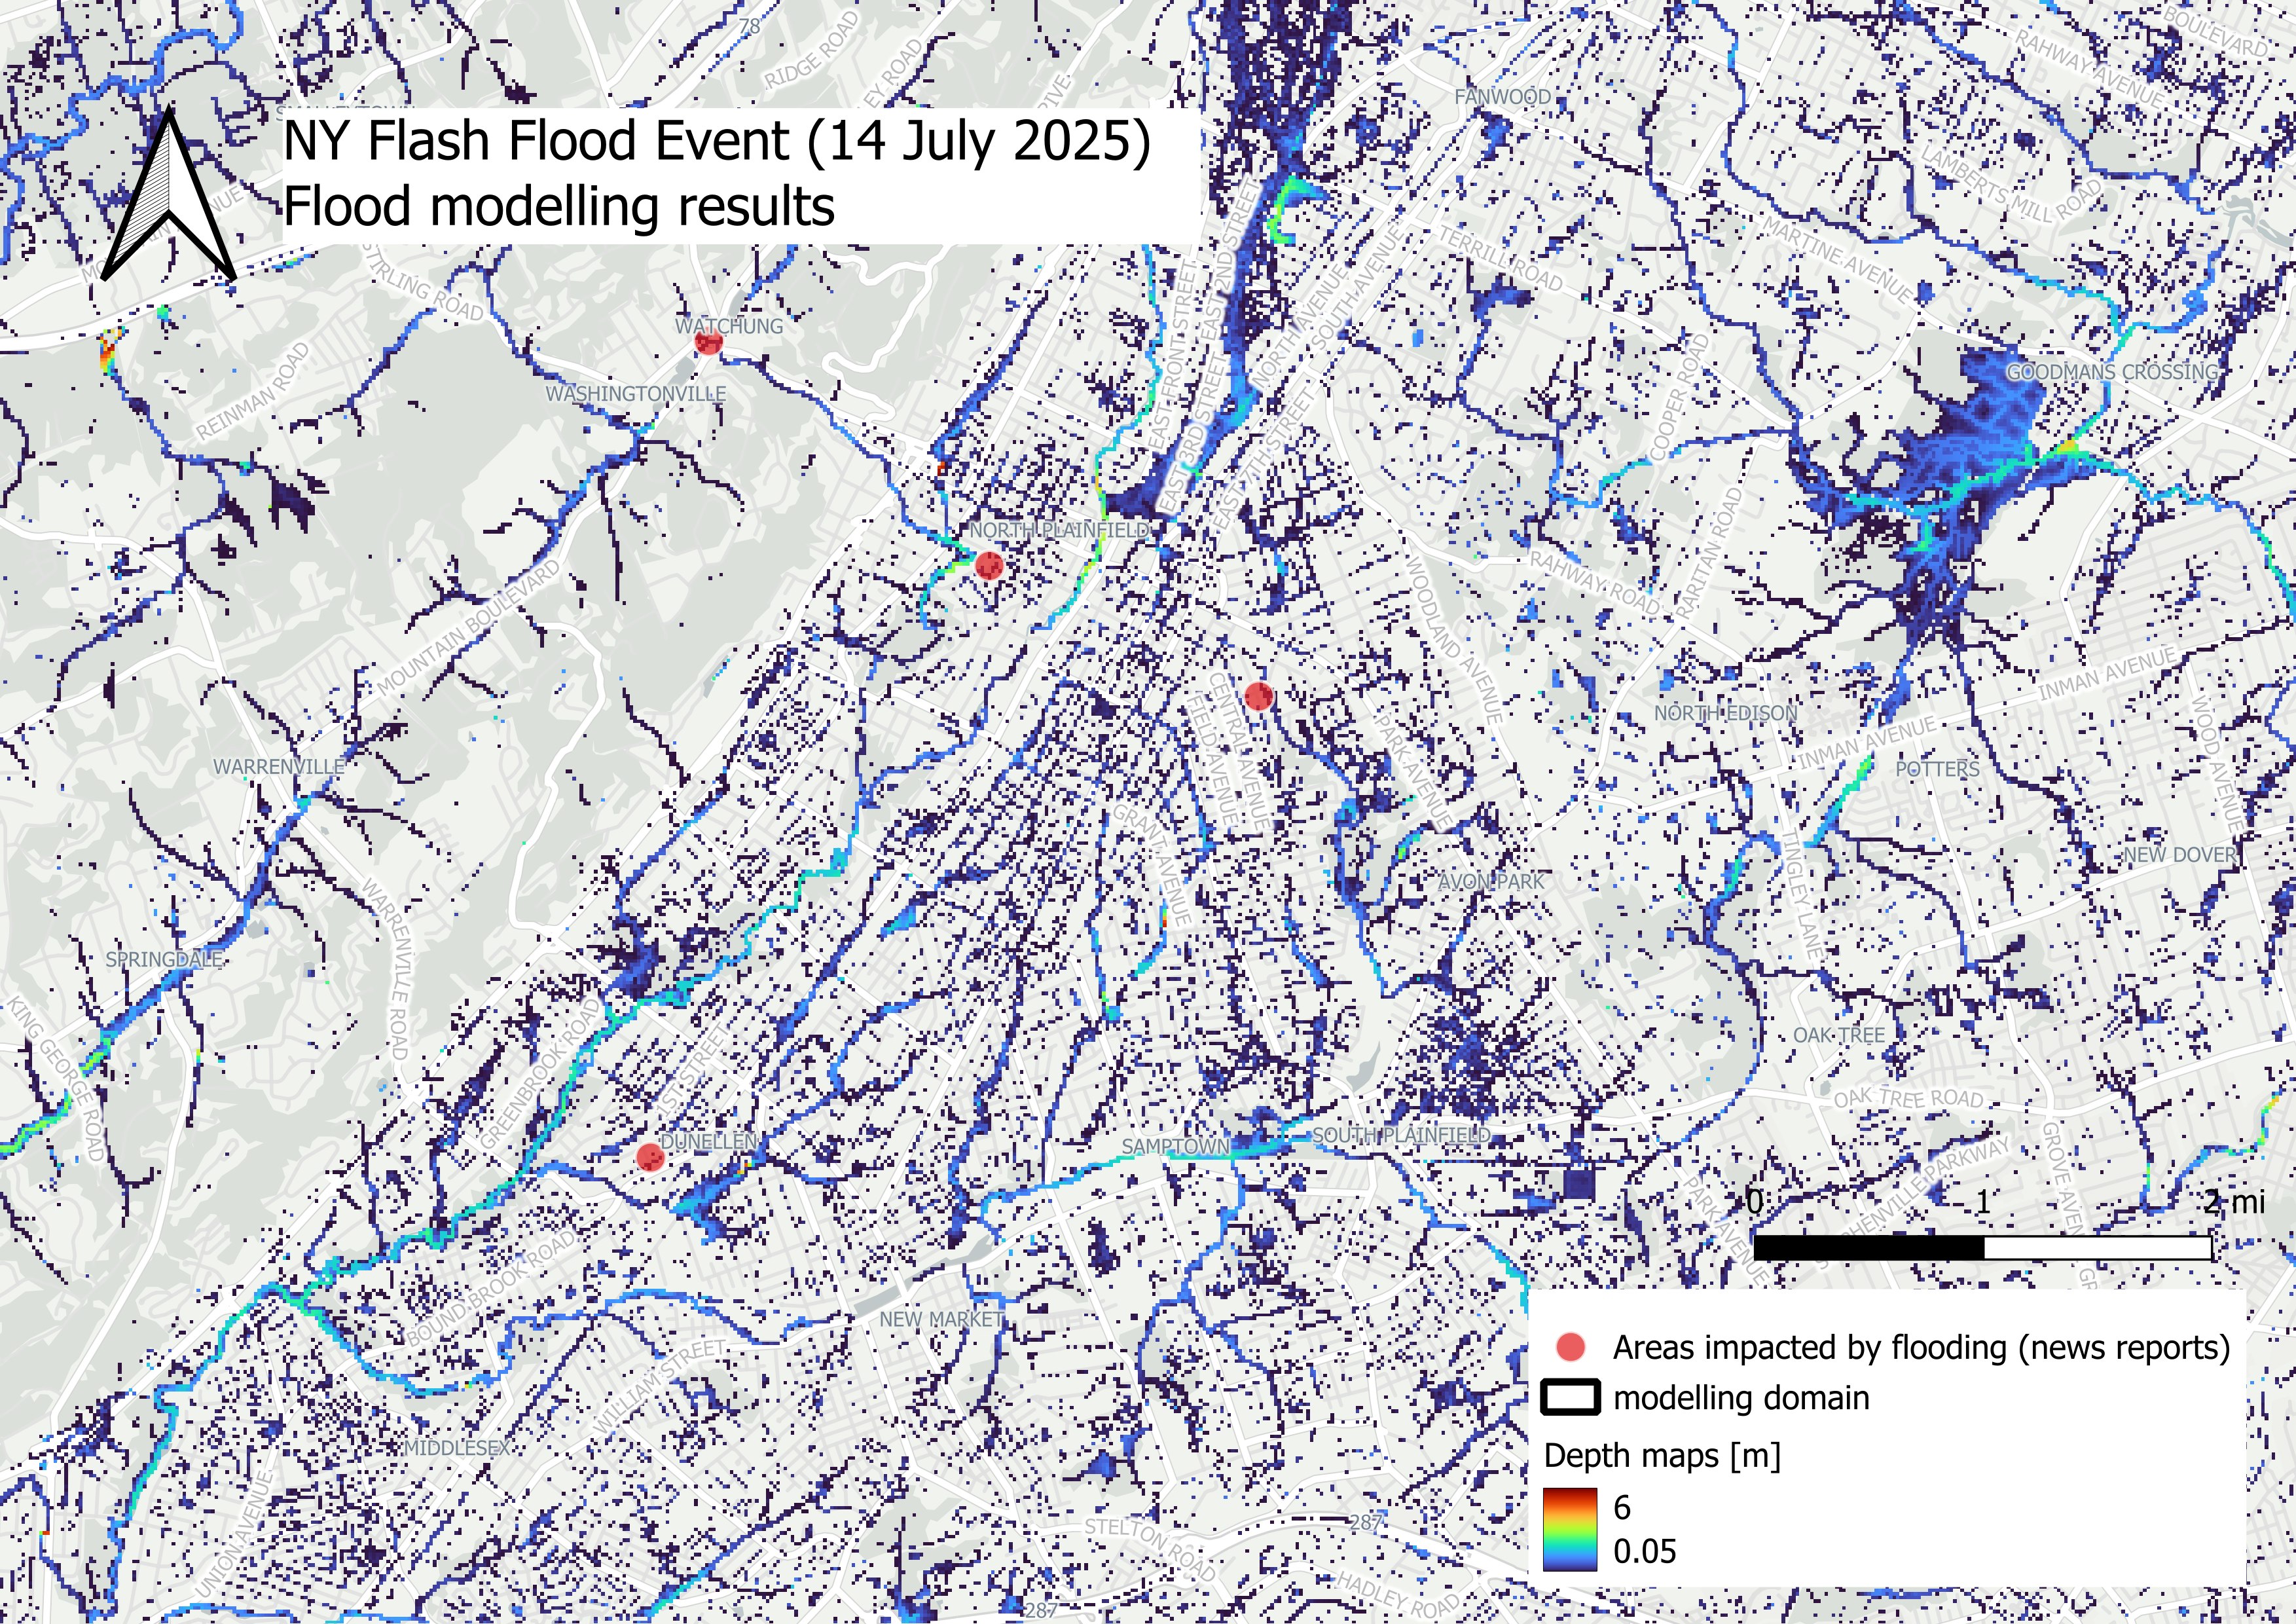
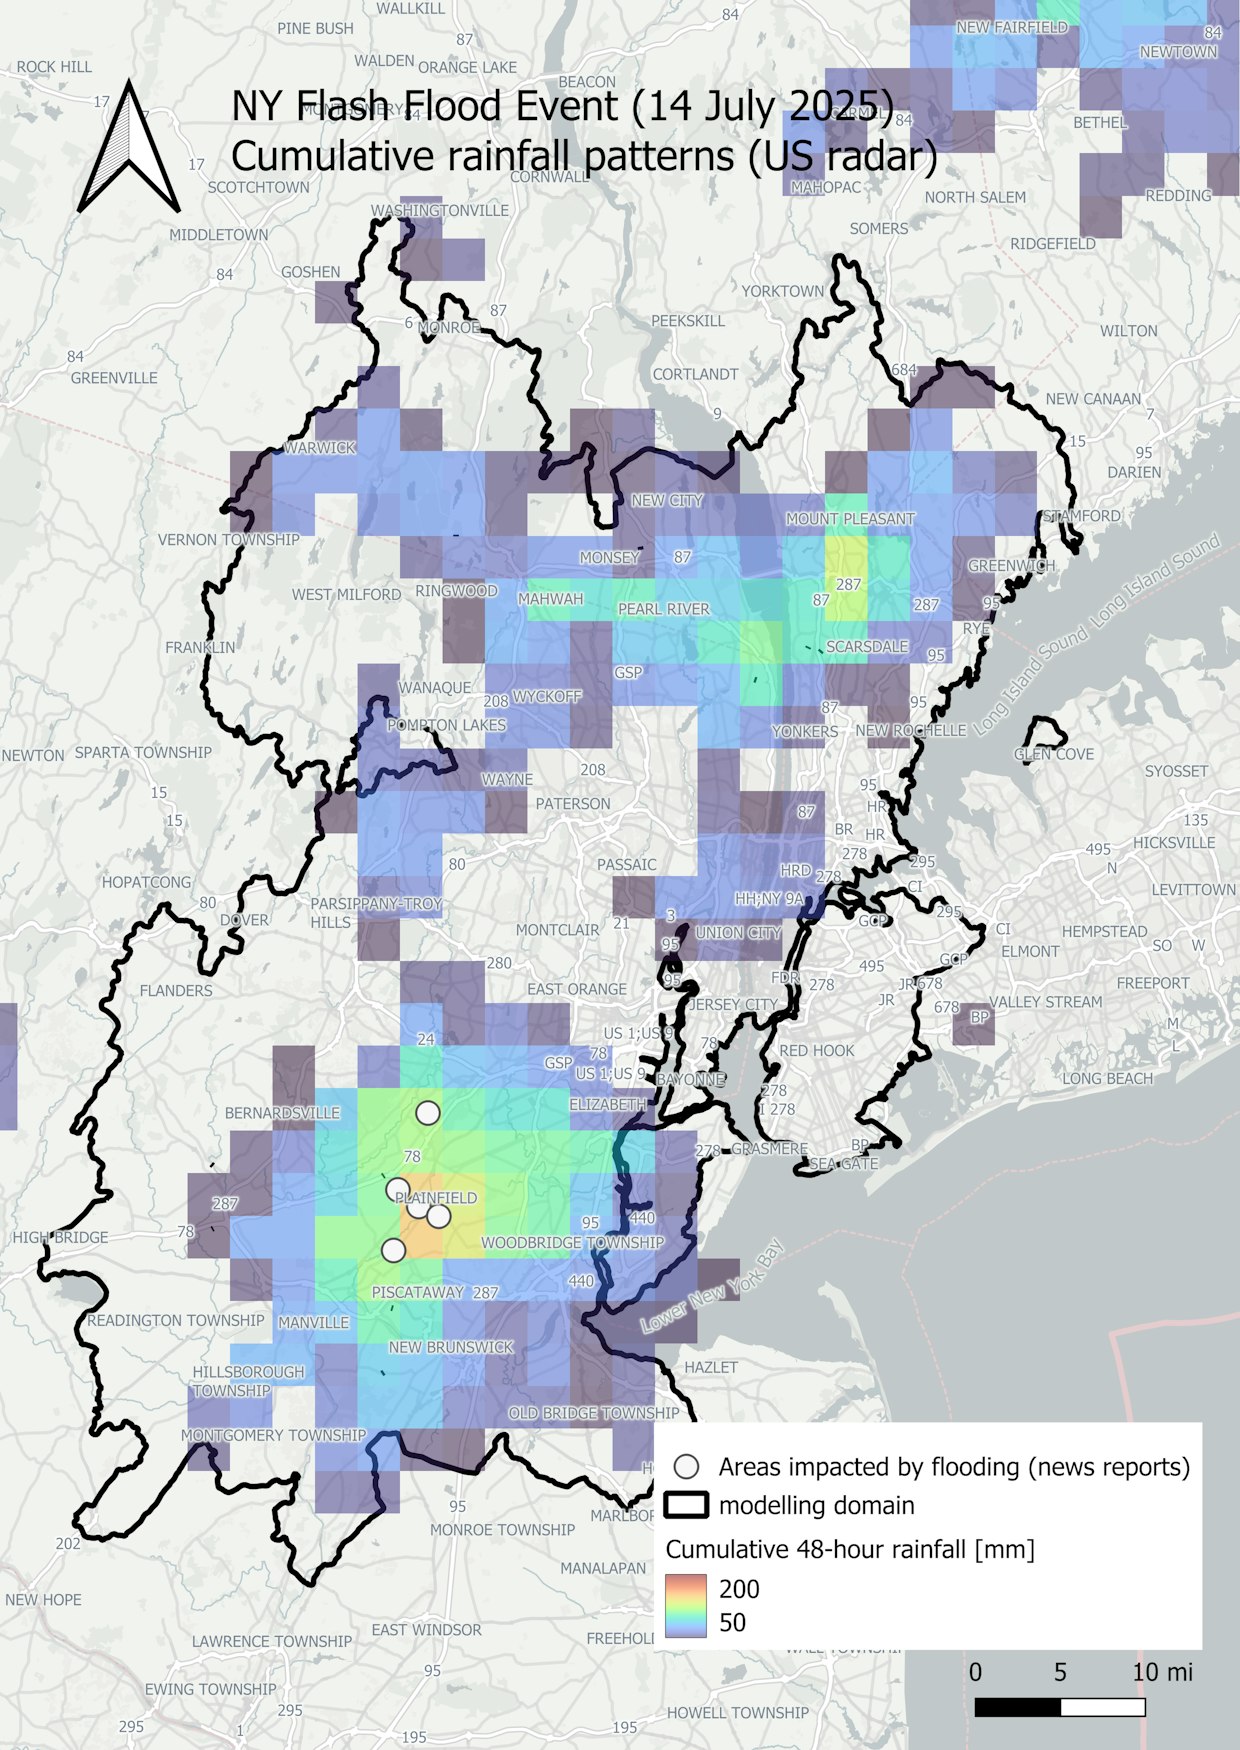
The points that have been recorded as impacted by flooding (e.g. from news sites) correlate well with local rainfall, indicating stormwater flooding. Our modelling results correlate well with these points as well.
Summary
Recently, the US has faced extreme weather events across the country, first with Texas and the flooding of the Guadalupe River at the beginning of July.
Now the Northeast coast has suffered from the impacts of flooding including severe disruption to the transport network, damage to people’s homes, businesses and vehicles and sadly some loss of life.
These events underscore the critical importance of early warning systems and real-time data, enabling communities and organisations to take proactive measures and reduce the impact of flooding.
Our retrospective analysis, conducted using Previsico’s flood forecasting model and cross-referenced with verified news reports on the timing and locations of flooding, demonstrates a strong correlation. This indicates that, had the system been deployed operationally, early warnings could have been delivered to the affected areas in advance of the flooding event.